Solar Panel ROI Timeline: Year by Year
What would this actually cost at your home?
Installed prices vary widely by roof, access and region. Get an installed price for your property from MCS-certified installers.
Get an Installed PriceFree, no obligation. Takes about 2 minutes.
What would this actually cost at your home?
Installed prices vary widely by roof, access and region. Get an installed price for your property from MCS-certified installers.
Get an Installed PriceWhat is the year-by-year ROI of solar panels?
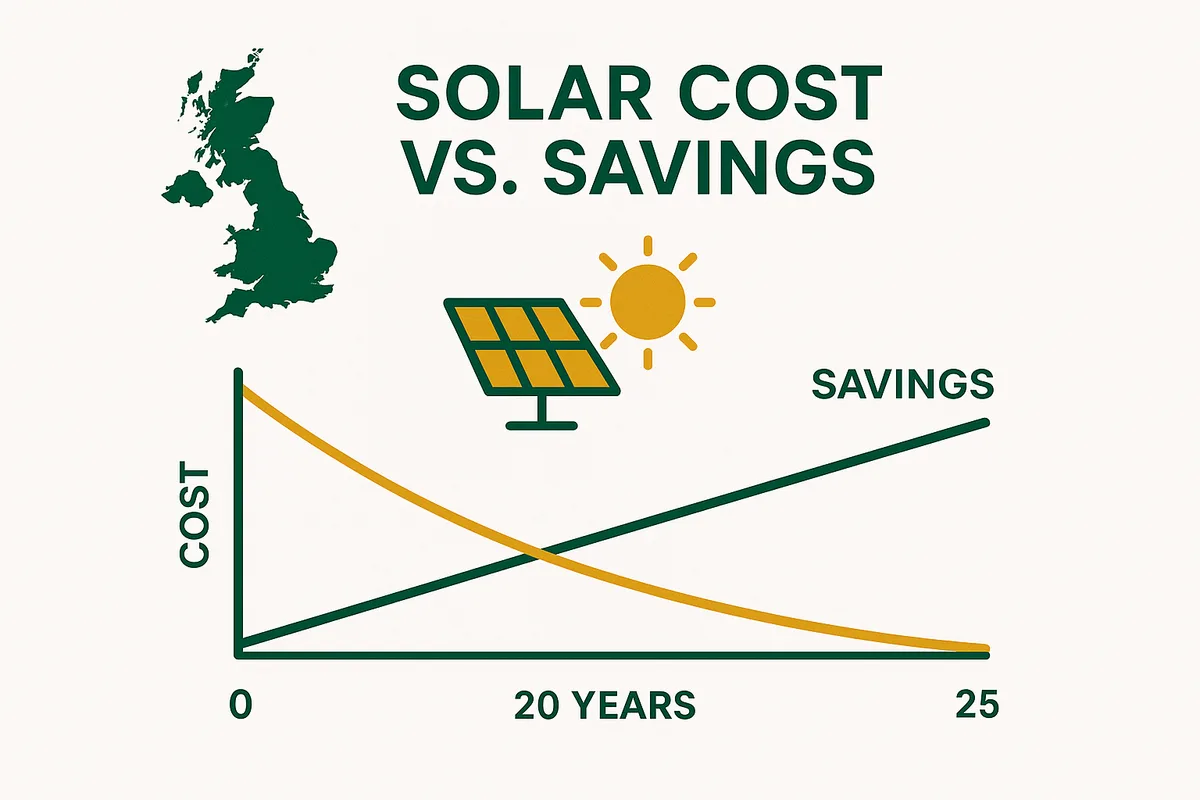
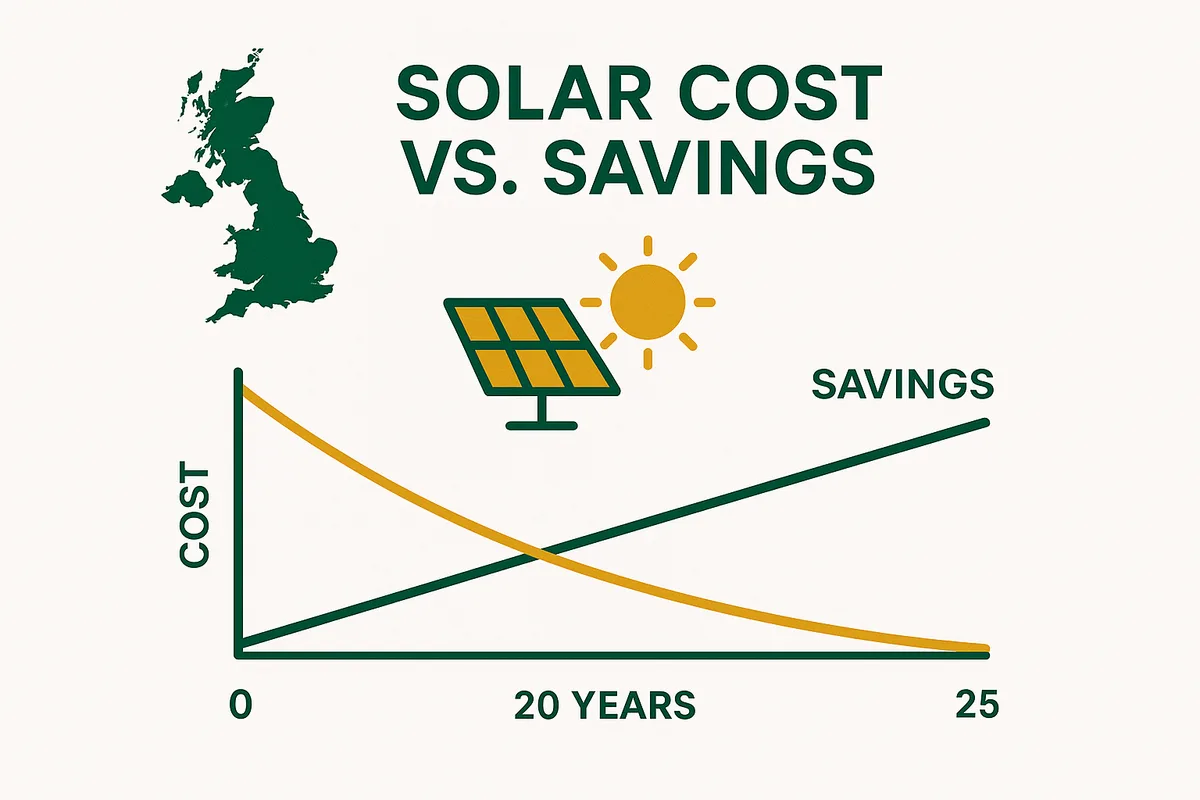
Solar ROI timeline for a 4kW system (£6,750): Year 0: -£6,750 (investment). Year 5: -£3,850 (saving £580/year). Year 8-10: break even. Year 12: inverter replaced (-£1,000, but cumulative savings cover it). Year 15: +£3,950 profit. Year 20: +£6,850 profit. Year 25: +£7,750 net profit (100%+ ROI). The majority of the financial benefit comes in years 12-25 — after payback and after the one inverter replacement.
Frequently Asked Questions
Related: Home Heating Systems
Solar panels are most powerful when combined with an efficient heating system. Heat pumps use solar-generated electricity to heat your home at 300-400% efficiency — making them the ideal partner for solar.
Heat pumps use electricity at 300-400% efficiency, making them ideal partners for solar.
From our sister site Home Heat Pump Guide
You might also like
What would this actually cost at your home?
Installed prices vary widely by roof, access and region. Get an installed price for your property from MCS-certified installers.
Get an Installed PriceFree, no obligation. Takes about 2 minutes.