How Much Do 10 Solar Panels Cost in the UK?
Find the right system size for your roof
Panel count depends on your electricity use, roof space and direction — not on a rule of thumb. Get a recommended size and what it should cost.
Size My SystemFree calculator. No contact details required to see your result.
How much do 10 solar panels cost in the UK?
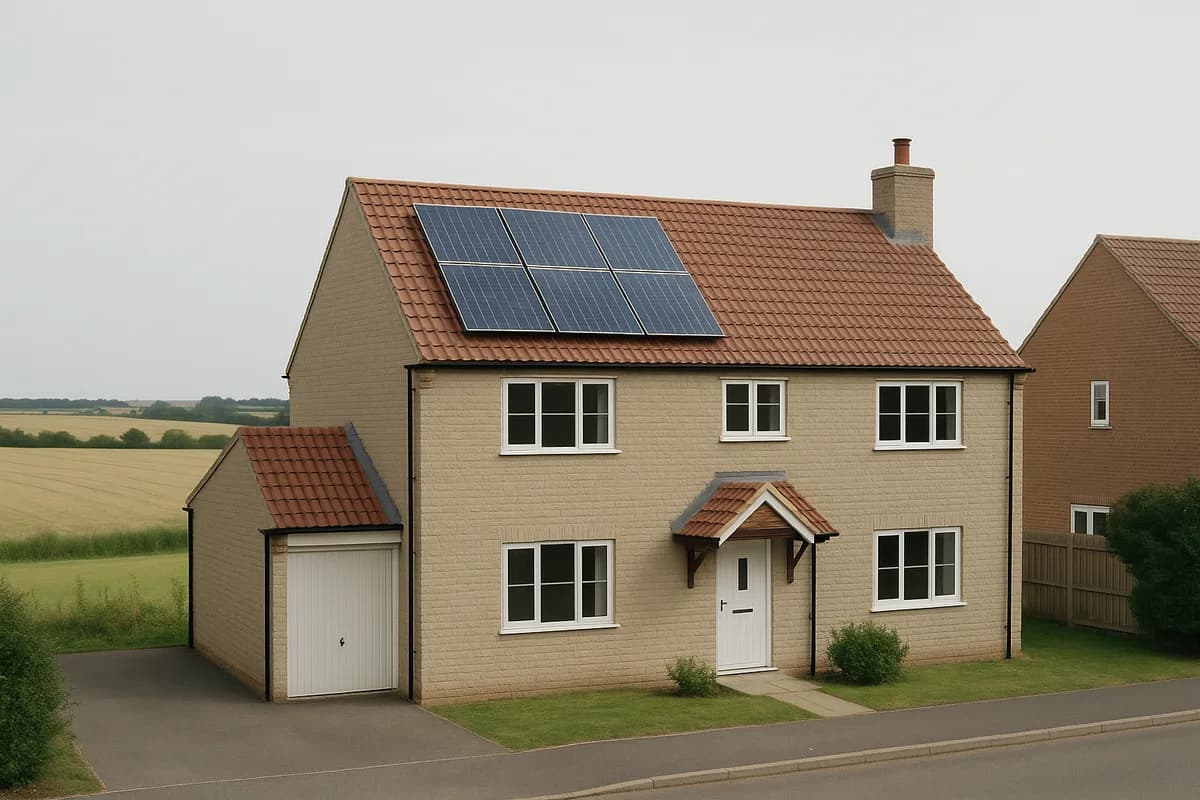
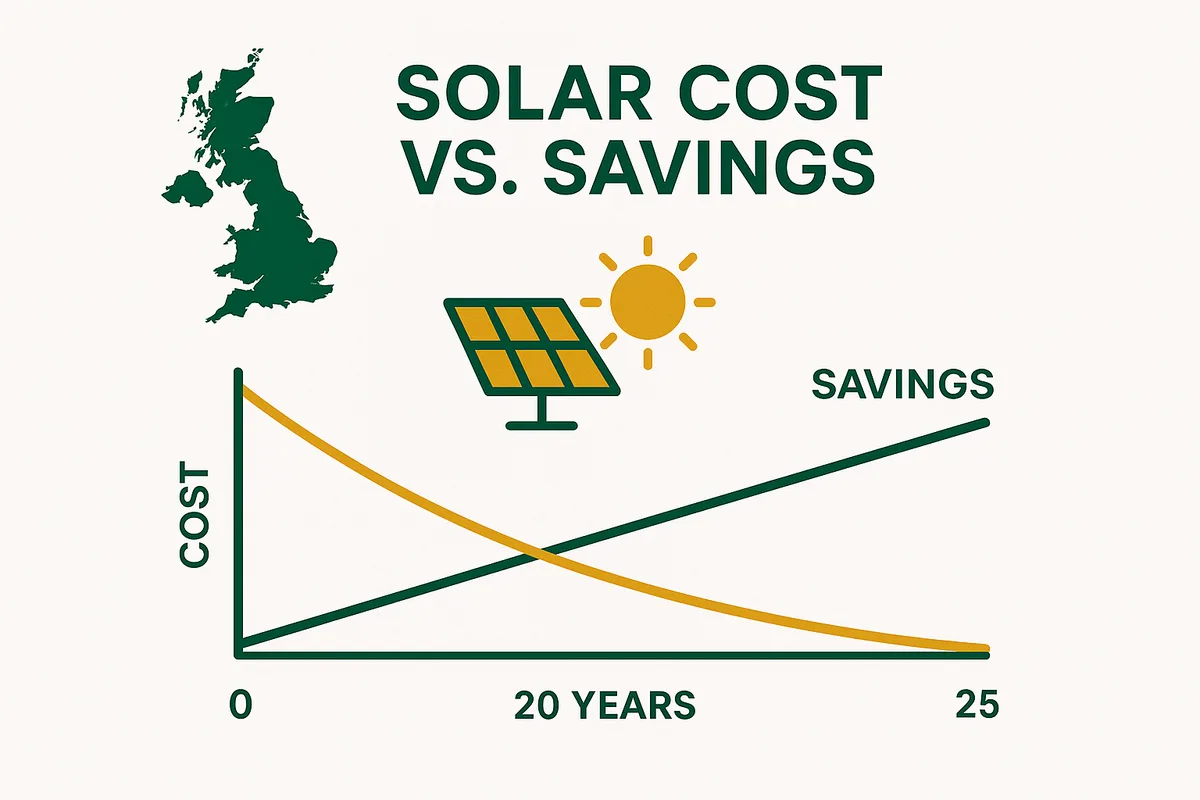
Ten solar panels is a system of roughly 4 kWp, and the median installed cost is about £7,120. That figure is 4 kWp multiplied by £1,780.25 per kW — the median price paid for 0–4 kW installations in 2025/26, published by DESNZ from the MCS Installation Database covering 265,682 installations. Ten panels generate about 3,880 kWh a year on an unshaded south-facing roof, ranging from about 3,320 kWh in northern Scotland to about 4,320 kWh in south-west England. At the Ofgem price cap of 26.11p per kWh that is worth roughly £594–£739 a year depending on your export tariff, giving a simple payback of about 9.6–12.0 years. VAT on qualifying residential installations is 0% until 31 March 2027.
What 10 Panels Actually Means
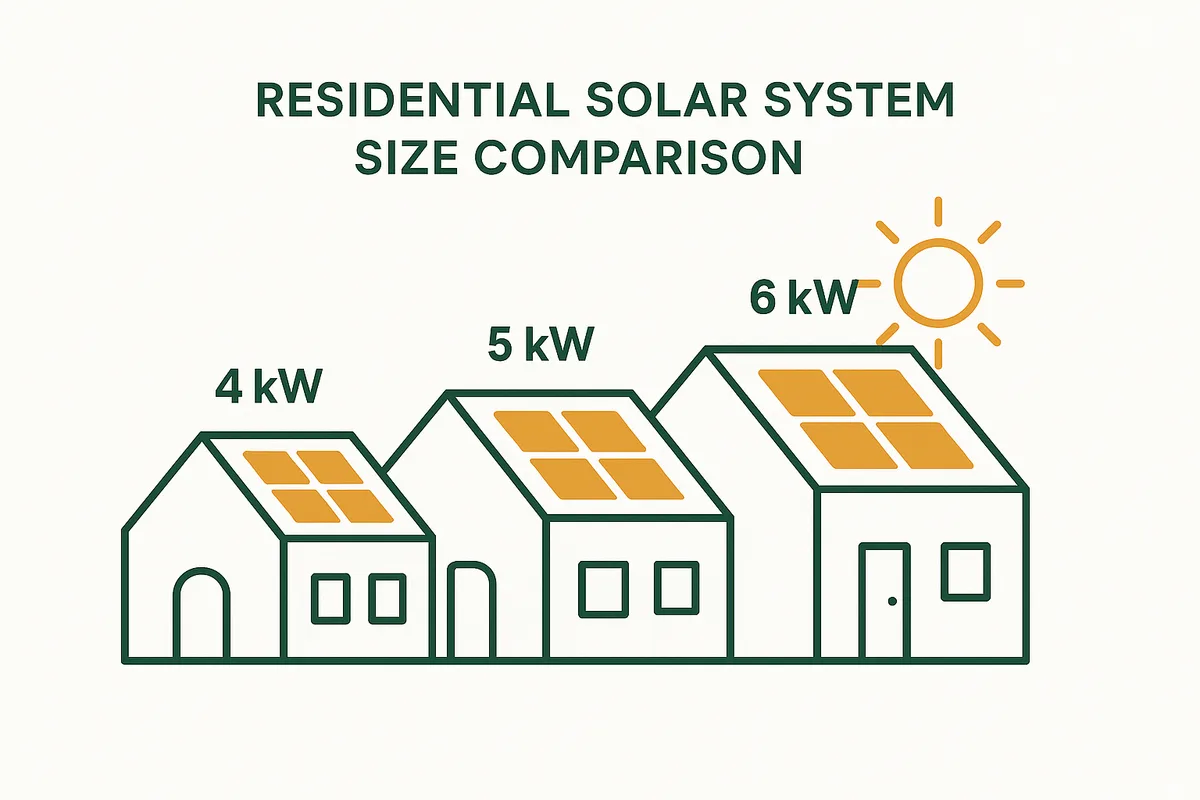
A panel count on its own does not describe a system. What matters is the wattage of each panel, because that is what sets the kilowatt-peak (kWp) rating everything else is calculated from.
The calculation is simply panel wattage × 10 ÷ 1,000:
| Panel wattage | System size | Annual generation (UK average) |
|---|---|---|
| 375 W | 3.75 kWp | ~3,638 kWh |
| 400 W | 4.00 kWp | ~3,880 kWh |
| 425 W | 4.25 kWp | ~4,122 kWh |
| 450 W | 4.50 kWp | ~4,365 kWh |
400 W is the most common wattage quoted for UK residential work at the time of writing, which is why 10 panels and "a 4kW system" are usually treated as the same thing. If your quote specifies a different wattage, redo the arithmetic — a 450 W array produces about 4,365 kWh a year against 3,638 kWh for a 375 W array, a difference of around 20% for the same ten panels.
Generation figures use 970 kWh per kWp per year, the UK average for a south-facing, unshaded, roughly 35° pitched roof, derived from PVGIS regional data. Your actual figure depends on where you live, which direction your roof faces, and what shades it.
What 10 Panels Cost — and Where That Number Comes From
Most cost pages give a range with no basis behind it. Here is the actual basis.
DESNZ publishes solar PV cost data derived from the MCS Installation Database. For 2025/26 the median price for installations in the 0–4 kW band was £1,780.25 per kW on a Declared Net Capacity basis, across 265,682 installations.
| Panel wattage | System size | Installed cost at the DESNZ median |
|---|---|---|
| 375 W | 3.75 kWp | ~£6,680 |
| 400 W | 4.00 kWp | ~£7,120 |
Three things this figure is not. It is a median, so half of installations cost more and half cost less — it is not a cap and it is not a quote. It is on a Declared Net Capacity basis, which runs 6–12% higher per kW than the Total Installed Capacity basis DESNZ also publishes, so never compare the two. And it covers MCS-certified work in England, Scotland and Wales only — Northern Ireland is not in the dataset.
At 425 W and above, ten panels take you past 4 kWp and out of the 0–4 kW band entirely. DESNZ reports larger systems separately, so the £1,780.25 rate does not apply to them and we have not extrapolated it.
Our UK Solar Price Observatory carries the full 13-year series and the regional breakdown. One thing worth knowing before you read regional numbers anywhere: DESNZ reports national figures as a median and regional figures as a mean. They are different statistics and cannot be compared with each other.
Source: DESNZ, Solar photovoltaic (PV) cost data, released 28 May 2026, Open Government Licence v3.0.
How Much You Save — With the Arithmetic Shown
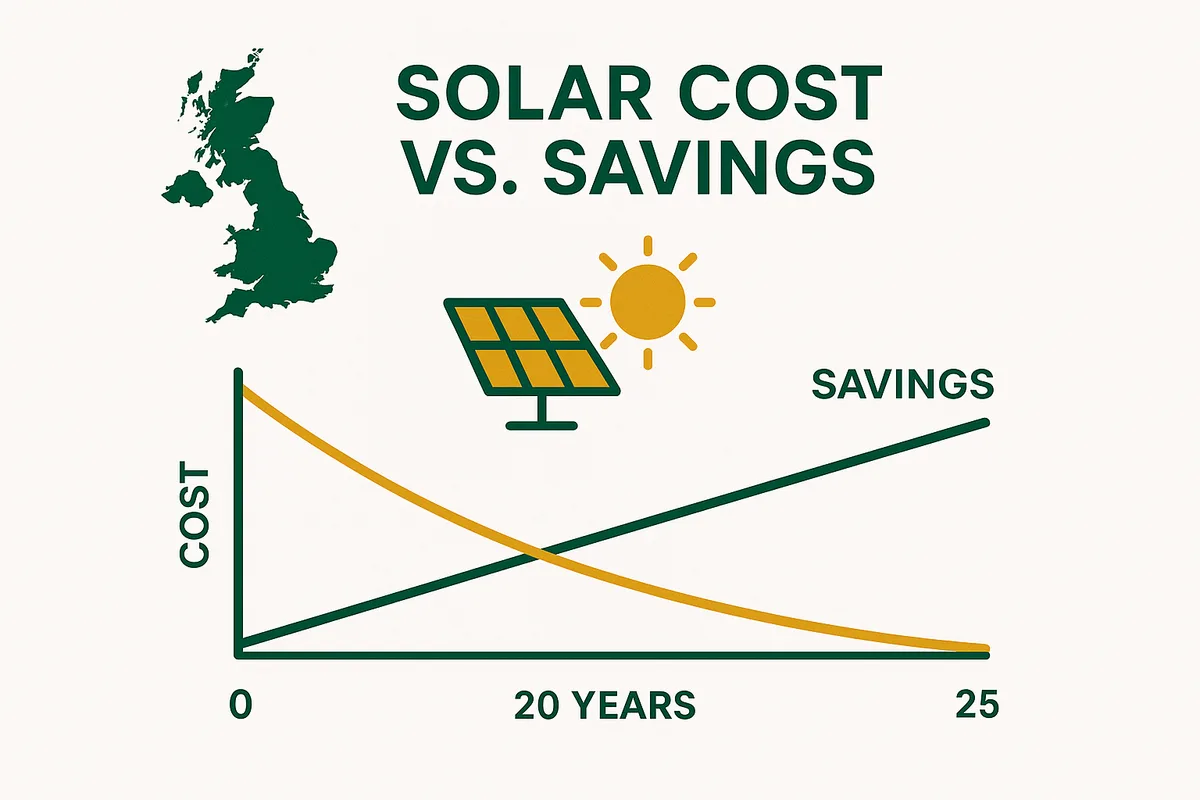
Savings come from two separate things, and mixing them up is the most common error on solar cost pages. Electricity you generate and use yourself avoids buying it at the price cap. Electricity you generate and export earns whatever your Smart Export Guarantee tariff pays, which is far less per unit.
Without a battery, a typical home self-consumes about half of what it generates.
| Step | Calculation | Result |
|---|---|---|
| Generated | 4 kWp × 970 kWh/kWp | 3,880 kWh |
| Used at home (50%) | 1,940 kWh × 26.11p | £507 |
| Exported (50%), conservative SEG | 1,940 kWh × 4.5p | £87 |
| Exported (50%), Outgoing Octopus | 1,940 kWh × 12p | £233 |
| Annual benefit | £594–£739 |
With a battery, self-consumption typically rises to about 80%.
| Step | Calculation | Result |
|---|---|---|
| Used at home (80%) | 3,104 kWh × 26.11p | £810 |
| Exported (20%), conservative SEG | 776 kWh × 4.5p | £35 |
| Annual benefit | £845–£904 |
The export rate matters more than people expect. The gap between a 4.5p fixed SEG tariff and Outgoing Octopus at 12p is worth about £233 minus £87 a year on the same system — more than the difference between many quotes. Ofgem obliges larger suppliers to offer an export tariff but sets no minimum rate, so this is a market choice you make, not a fixed feature of solar.
Electricity rate: Ofgem price cap, 26.11p per kWh, Great Britain average, Direct Debit, 1 July to 30 September 2026. It changes quarterly. Use our savings calculator to run these numbers on your own consumption rather than the average.
Payback — and Why We Do Not Publish a 25-Year Return
Simple payback is the installed cost divided by the annual benefit.
| Scenario | Cost | Annual benefit | Simple payback |
|---|---|---|---|
| 10 panels, conservative SEG | £7,120 | £594 | ~12.0 years |
| 10 panels, Outgoing Octopus | £7,120 | £739 | ~9.6 years |
| 10 panels + battery | £7,120 + battery | £845–£904 | ~14.3 years |
The battery line uses a market estimate of £5,000 for a ~10 kWh installed battery. That number is not from the DESNZ dataset — DESNZ publishes solar PV costs, not battery costs — so treat it as indicative and replace it with your own quotes.
What these payback figures deliberately exclude: panel degradation (roughly 0.4–0.5% a year on most warranties), future electricity price movements in either direction, one inverter replacement somewhere around year 10–15, and any maintenance. Every one of those requires an assumption about the 2030s that nobody can evidence today.
That is also why you will not find a 25-year ROI figure on this page. Producing one means compounding four unknowable assumptions over 25 years and presenting the result to the nearest pound. The honest version is the payback range above, plus the statement that panels are typically warranted to still produce around 80–90% of their original output at year 25.
Find the right system size for your roof
Panel count depends on your electricity use, roof space and direction — not on a rule of thumb. Get a recommended size and what it should cost.
Size My SystemWill 10 Panels Fit Your Roof?
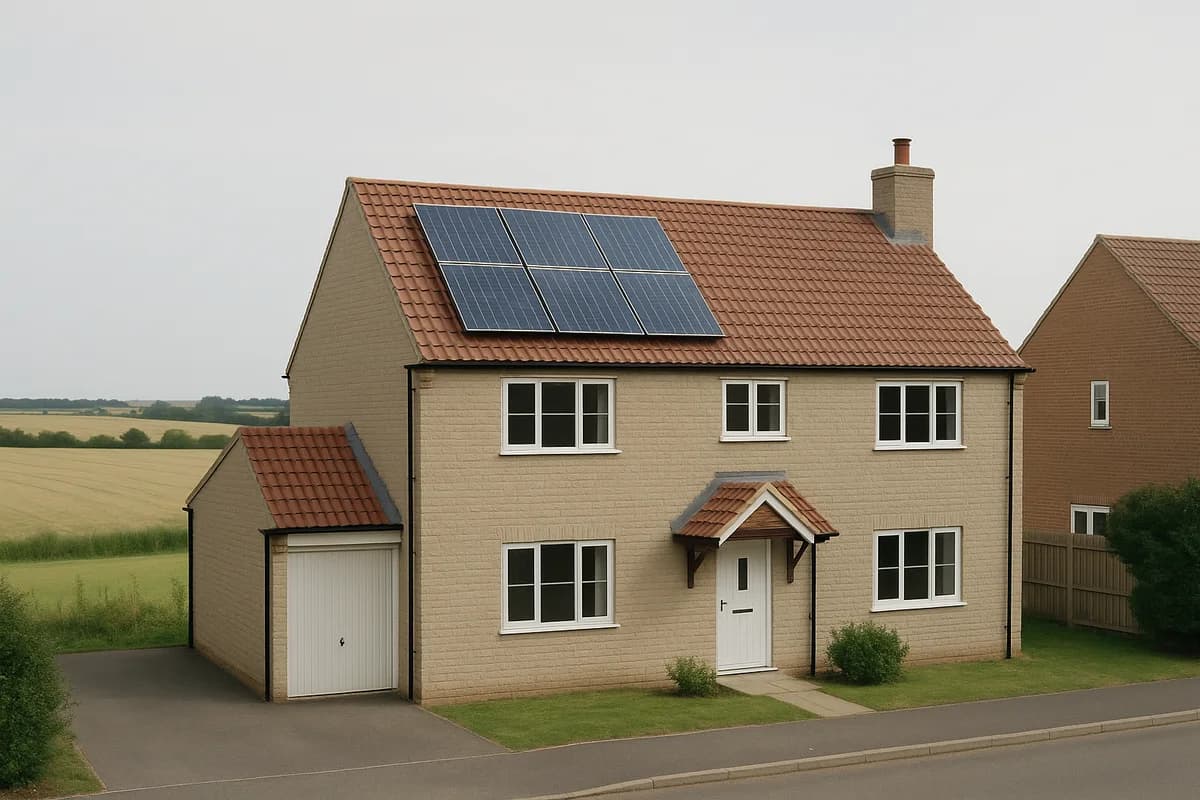
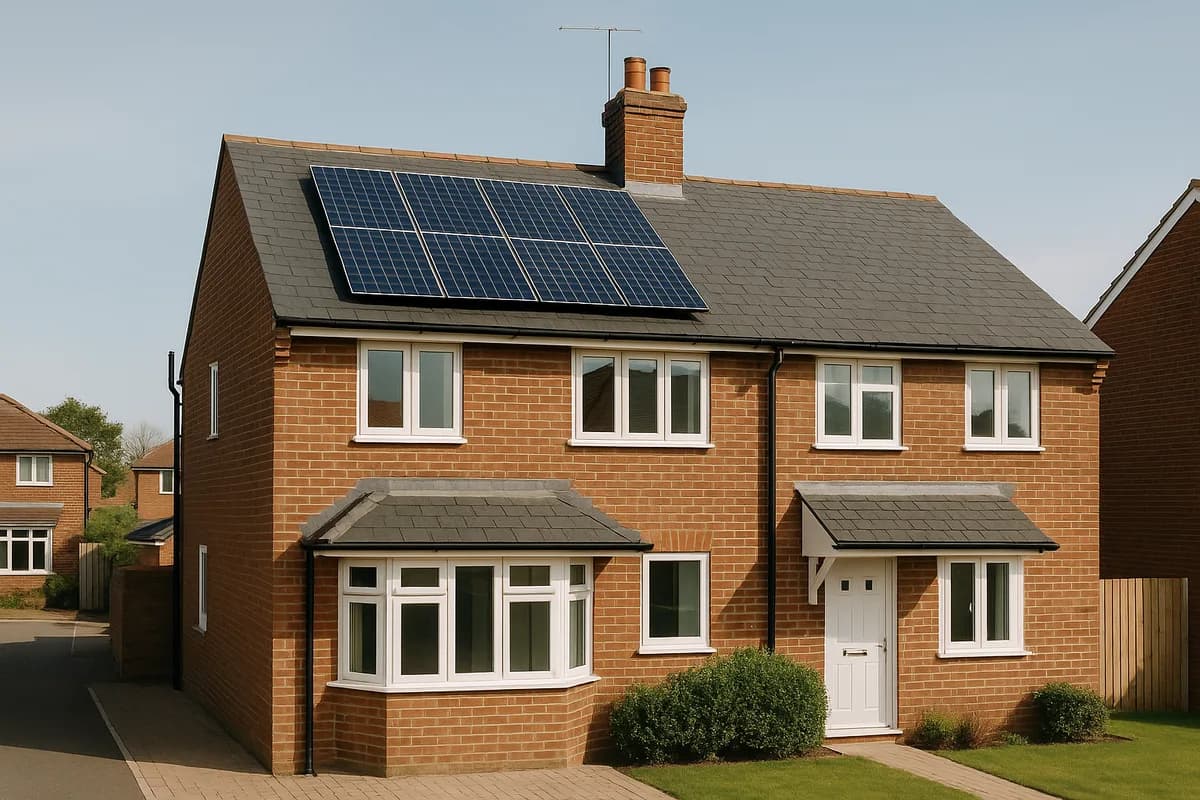
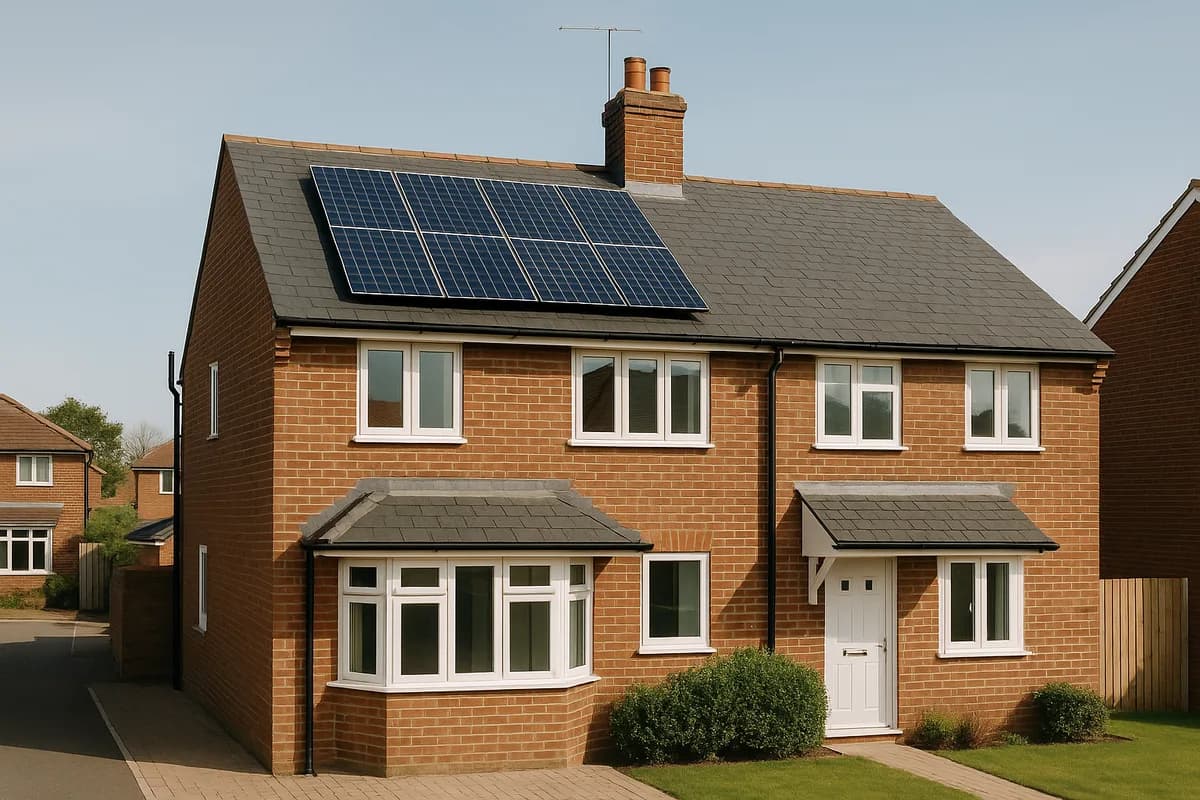
A typical residential panel is around 1.75 m × 1.10 m, so roughly 1.9 m² each. Ten of them is about 19 m² of panel.
Installers do not fill a roof edge to edge. Allowing for edge setbacks, access and mounting, plan on roughly 21–23 m² of unshaded roof on a single slope. Most 3-bed semi-detached and detached UK homes have this on one pitch; many terraced houses do not, and end-of-terrace often does.
The roof itself matters as much as its size:
- Orientation. South is best. East–west splits typically lose around 15–20% of annual output but spread generation across the morning and evening, which can raise self-consumption.
- Shading. A chimney, tree or neighbouring roof shading part of the array cuts output disproportionately on a string inverter. Optimisers or micro-inverters mitigate this at extra cost.
- Roof condition. Panels last 25–30 years. If the roof needs recovering within ten, do that first — removing and refitting an array later is a real cost.
- Structure and electrics. Ten panels add roughly 200 kg spread across the roof. Your installer checks the structure and whether the consumer unit needs work.
Your installer submits the DNO connection application as part of the job. Which route applies depends on your system's rated export capacity — ask your installer to confirm which one your design falls under.
Our roof suitability checker covers orientation and shading before you speak to anybody.
Should You Add a Battery?
On the numbers above a battery raises the annual benefit from about £594–£739 to about £845–£904, but it also adds several thousand pounds to the cost. The result is more money saved in absolute terms and a longer payback in percentage terms.
A battery tends to make more sense when: you are out during the day and use most of your electricity in the evening; you can access a time-of-use import tariff and charge cheaply overnight; you have an EV or heat pump lifting your consumption; or your export tariff is poor, which makes stored units worth much more than exported ones.
It tends to make less sense when: you are at home during the day and already self-consume most of what you generate; you have a strong export tariff such as Outgoing Octopus, which narrows the gap between using a unit and selling it; or your budget is better spent on more panels first.
The order that usually works: fill the roof with panels, get the best export tariff you can, then decide on a battery once you can see a year of real generation data.
How to Check a 10-Panel Quote
- Confirm the panel wattage, not just the count — "10 panels" is anywhere between 3.75 and 4.5 kWp
- Check the total kWp on the quote matches wattage × 10 ÷ 1,000
- Compare the price per kW against the DESNZ median of about £1,780.25/kW rather than against another salesperson's price
- Check VAT is charged at 0% — qualifying residential installations are zero-rated until 31 March 2027
- Ask which generation estimate they used and whether it accounts for your orientation and shading
- Confirm the installer is MCS-certified, or certified under an equivalent accredited scheme, since export tariffs depend on it
- Check whether scaffolding, DNO application and the consumer unit are inside the price or extras
- Get the inverter make, model and rating in writing, and whether it is battery-ready
Paste a quote into our quote checker to see how its price per kW compares with the published DESNZ distribution, or get quotes if you are starting from scratch.
Methodology and Limitations
Every number on this page is calculated from a stated source. Nothing is a market rumour or a rounded guess.
| Input | Value | Source | Basis |
|---|---|---|---|
| Installed cost | £1,780.25/kW | DESNZ Solar PV cost data, released 28 May 2026 | Median, 0–4 kW band, 2025/26, Declared Net Capacity, 265,682 installations |
| Annual yield | 970 kWh/kWp | PVGIS-derived regional averages | South-facing, unshaded, ~35° pitch, UK average |
| Electricity rate | 26.11p/kWh | Ofgem price cap | GB average, Direct Debit, 1 Jul–30 Sep 2026, includes 5% VAT |
| Export rate | 4.5p and 12p/kWh | Market observation of published SEG tariffs | Not a regulated rate — Ofgem sets no minimum |
| VAT on installation | 0% | HMRC energy-saving materials notice | Qualifying residential installations, until 31 March 2027 |
| Battery cost | £5,000 | Market estimate | NOT from the DESNZ dataset — indicative only |
Where these numbers stop being reliable. The DESNZ figure is a national median of MCS-certified work in England, Scotland and Wales; it does not describe your street, your installer, or Northern Ireland. The yield figure is a UK average and shifts by roughly ±15% by region before you account for orientation and shading. The electricity rate changes every quarter, and everything derived from it changes with it. Self-consumption of 50% without a battery and 80% with one are widely used planning assumptions, not measurements of your household — yours will differ, and that single input moves the savings figure more than anything else on this page.
We publish our full workings at how we calculate solar savings. Assumptions on this page were verified on 8 August 2026 and are next due for review when Ofgem sets the October cap.
Frequently Asked Questions
Related guides
Related: Home Heating Systems
Solar panels are most powerful when combined with an efficient heating system. Heat pumps use solar-generated electricity to heat your home at 300-400% efficiency — making them the ideal partner for solar.
Heat pump installation typically takes 2-3 days and is best planned alongside solar.
From our sister site Home Heat Pump Guide
You might also like
Find the right system size for your roof
Panel count depends on your electricity use, roof space and direction — not on a rule of thumb. Get a recommended size and what it should cost.
Size My SystemFree calculator. No contact details required to see your result.