Solar Panel Electricity Savings: Real Numbers
What would this actually cost at your home?
Installed prices vary widely by roof, access and region. Get an installed price for your property from MCS-certified installers.
Get an Installed PriceFree, no obligation. Takes about 2 minutes.
How much do solar panels save on electricity?
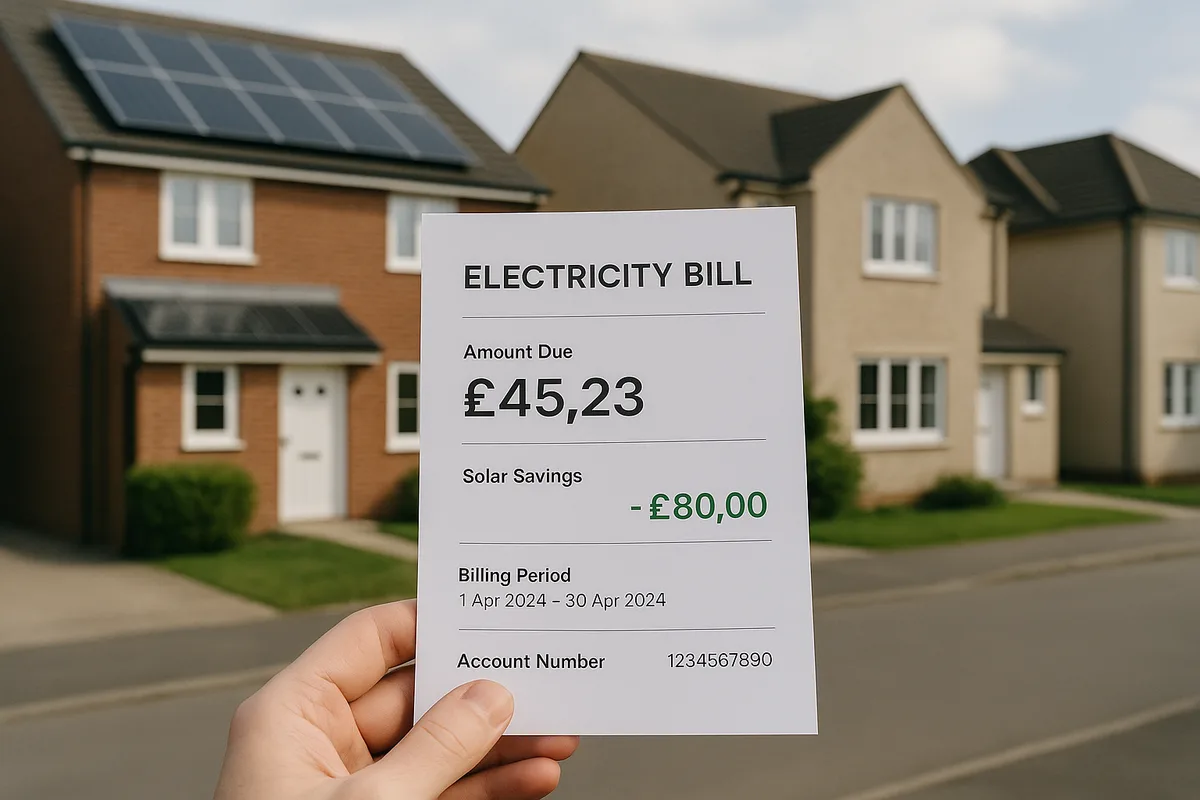
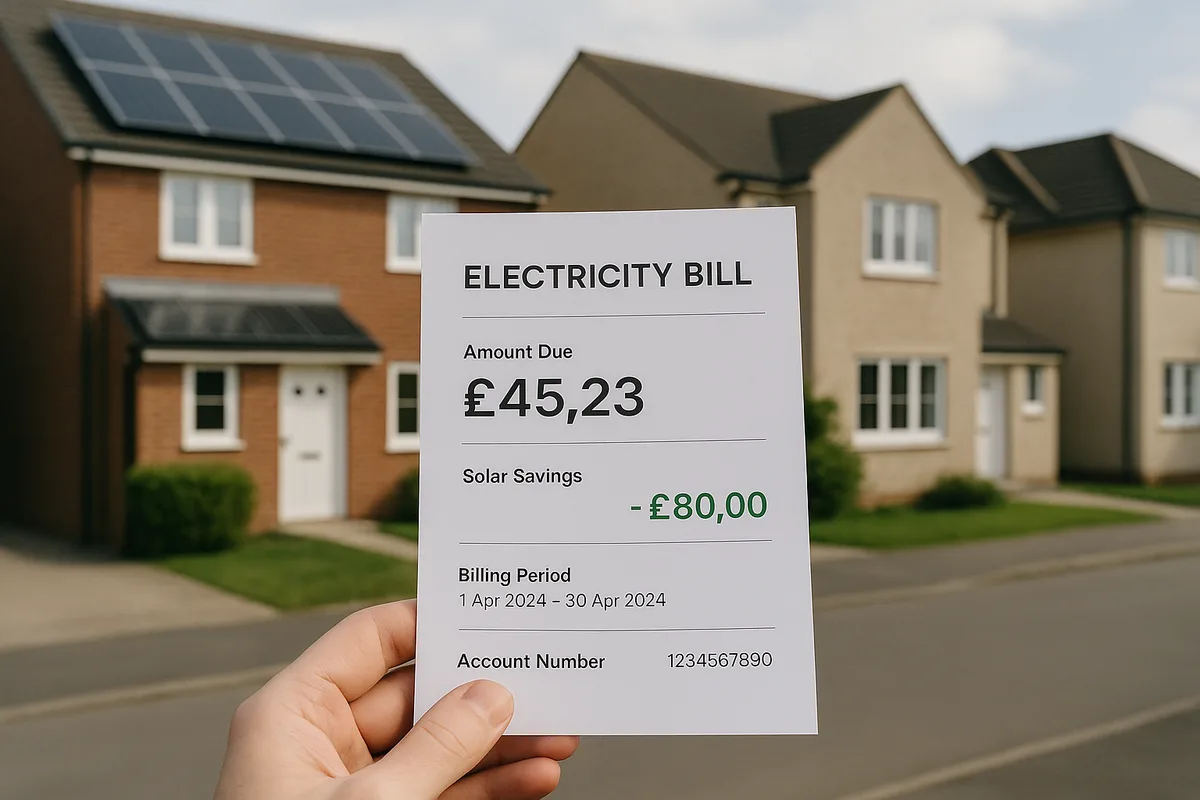
UK solar panels save £580–£1,100 per year on electricity depending on system size, self-consumption rate, and whether you have a battery. A 4kW system saves £580/year without battery (50% self-consumption) or £820/year with a 10kWh battery (80% self-consumption). These savings include both: reduced grid imports (worth 26.11p/kWh) and Smart Export Guarantee income (4–15p/kWh for surplus). All figures are based on Ofgem price cap July-September 2026 rates.
Savings by System Size and Setup
Annual electricity savings (Ofgem price cap July-September 2026: 26.11p/kWh, SEG: 4.5p/kWh):
| System | Battery? | Self-Consumption | Bill Saving | SEG Income | Total |
|---|---|---|---|---|---|
| 3kW | No | 50% | £368 | £68 | £436 |
| 3kW | 5kWh | 75% | £551 | £34 | £585 |
| 4kW | No | 50% | £490 | £90 | £580 |
| 4kW | 10kWh | 80% | £784 | £36 | £820 |
| 5kW | No | 50% | £613 | £113 | £726 |
| 5kW | 10kWh | 80% | £980 | £45 | £1,025 |
| 6kW | No | 50% | £735 | £135 | £870 |
| 6kW | 13kWh | 80% | £1,176 | £54 | £1,230 |
With Octopus Flux tariff optimisation (battery owners): - Peak export at 15–24p/kWh during 16:00–19:00: adds £100–£300/year - Overnight cheap charging at 7.5p/kWh: additional arbitrage savings - 4kW + battery + Flux: £1,020–£1,120/year total - 6kW + battery + Flux: £1,430–£1,530/year total
Source: Ofgem price cap July-September 2026; Octopus Flux tariff rates; PVGIS UK yields.
What Drives Your Actual Savings?
The biggest factors determining YOUR specific savings:
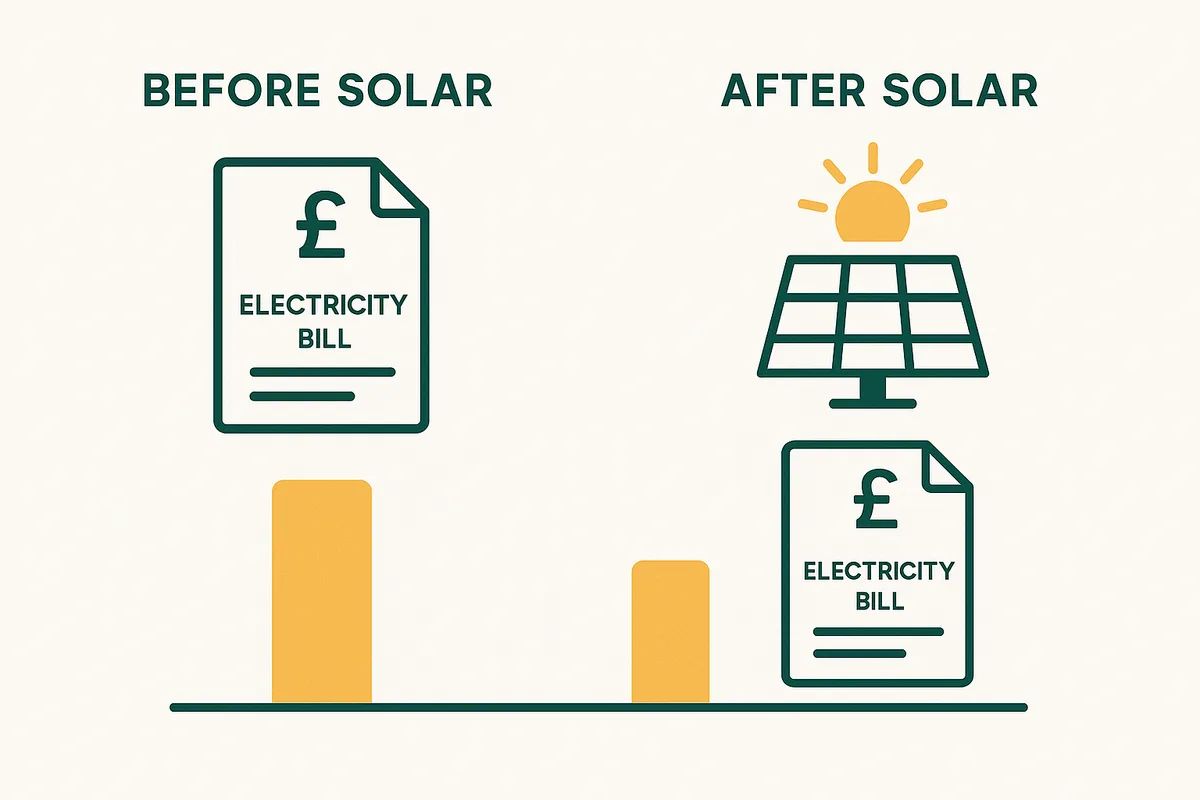
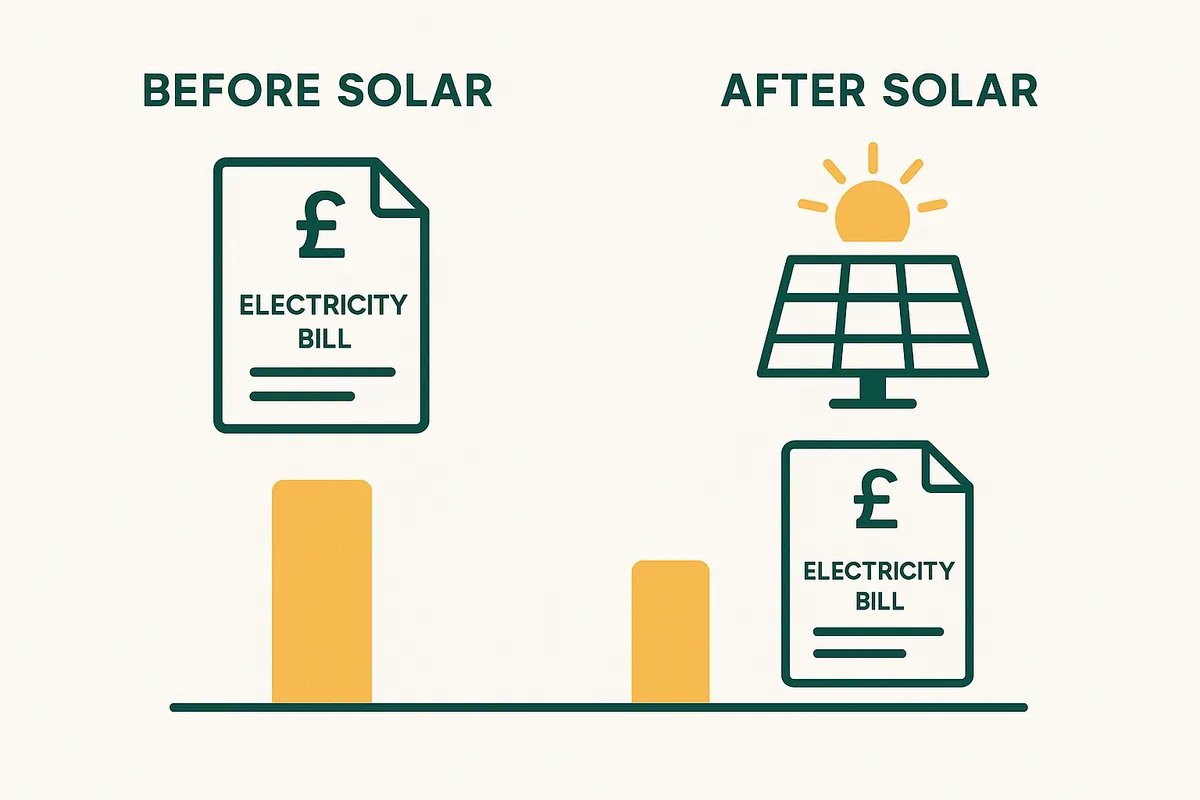
- Self-consumption rate — THE most important factor. Using solar directly saves 26.11p/kWh. Exporting earns only 4.5p/kWh. Every kWh shifted from export to self-use adds 20p of value.
- Your consumption pattern — home during the day? Higher self-consumption = higher savings. At work all day? Lower self-consumption (battery helps).
- System size vs consumption — a 4kW system matching your 3,700 kWh consumption is better than a 6kW system on a 2,500 kWh household (more surplus exported at low value).
- Battery — increases self-consumption from ~50% to ~80%, adding £150–£400/year in extra value.
- Smart tariff — Octopus Flux/Go adds £100–£300/year through tariff arbitrage (with battery).
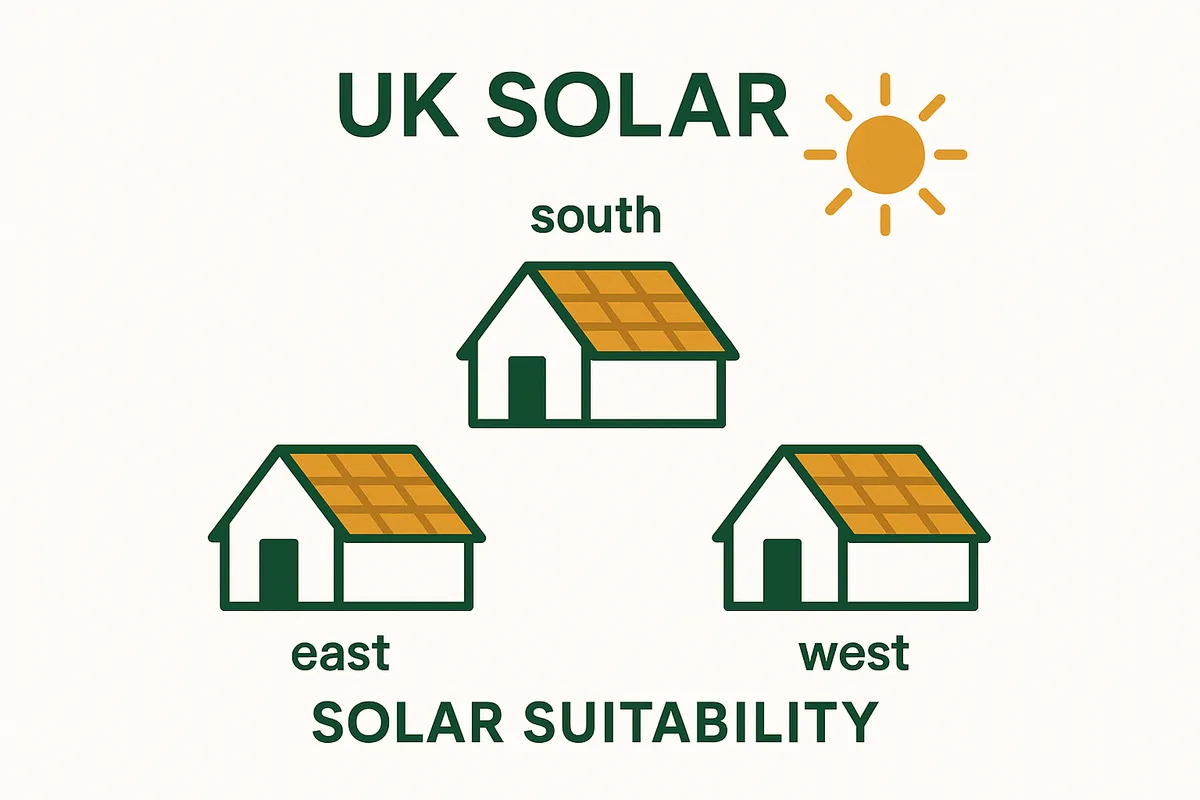
- Roof direction — south = 100% output. East/west = 80-85%. This directly scales your savings proportionally.
- Location — south of England generates ~15% more than northern Scotland. Savings scale accordingly.
- Electricity price — the higher the grid rate, the more each self-consumed kWh is worth. If prices rise, your savings automatically increase.
What would this actually cost at your home?
Installed prices vary widely by roof, access and region. Get an installed price for your property from MCS-certified installers.
Get an Installed Price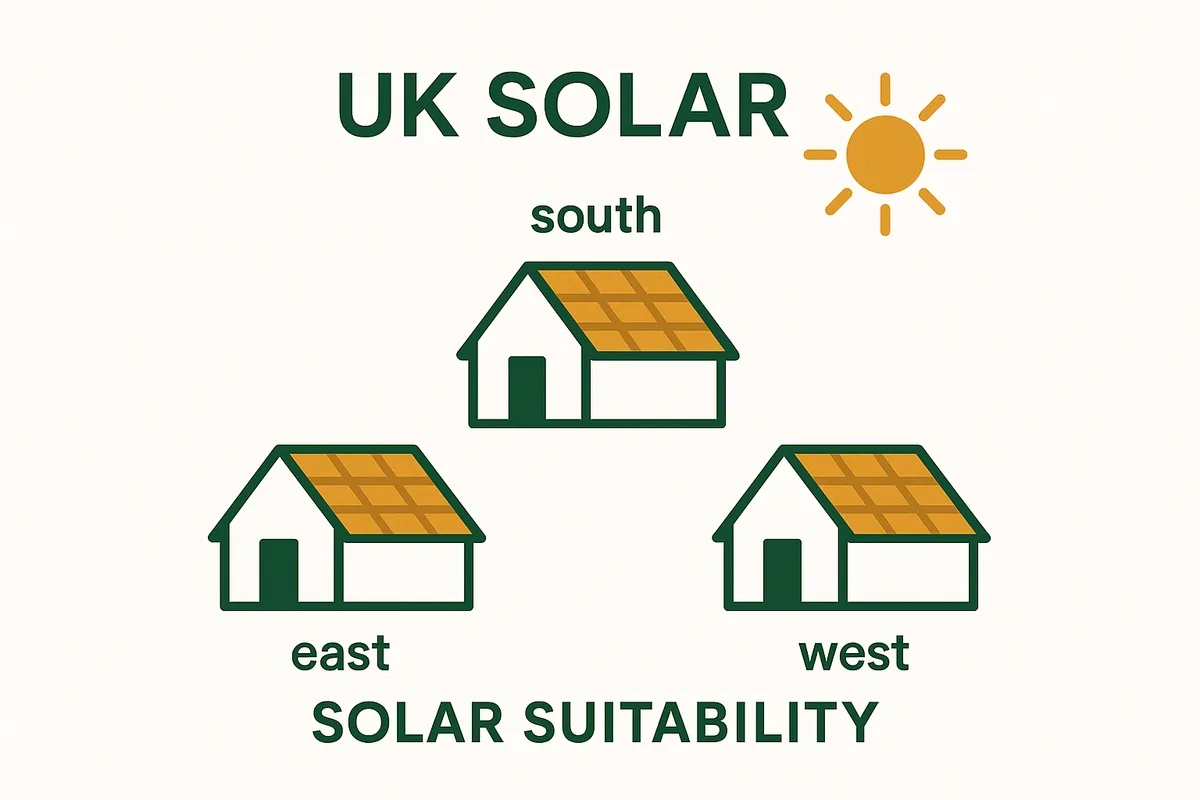
Monthly Savings Breakdown
4kW system, no battery, south-facing (monthly):
| Month | Generation | Self-Consumed | Bill Saving | SEG Income | Total |
|---|---|---|---|---|---|
| January | 100 kWh | 50 kWh | £12 | £2 | £14 |
| February | 150 kWh | 75 kWh | £18 | £3 | £21 |
| March | 300 kWh | 150 kWh | £37 | £7 | £44 |
| April | 420 kWh | 210 kWh | £51 | £9 | £60 |
| May | 500 kWh | 250 kWh | £61 | £11 | £72 |
| June | 520 kWh | 260 kWh | £64 | £12 | £76 |
| July | 500 kWh | 250 kWh | £61 | £11 | £72 |
| August | 450 kWh | 225 kWh | £55 | £10 | £65 |
| September | 350 kWh | 175 kWh | £43 | £8 | £51 |
| October | 220 kWh | 110 kWh | £27 | £5 | £32 |
| November | 120 kWh | 60 kWh | £15 | £3 | £18 |
| December | 80 kWh | 40 kWh | £10 | £2 | £12 |
| Annual | 3,710 kWh | 1,855 kWh | £454 | £83 | £537 |
~70% of savings come from April–September. Winter savings are modest but still contribute.
With a battery: winter evening savings improve significantly (battery covers 4–6 hours of evening use from stored daytime solar).
Source: PVGIS monthly UK generation; Ofgem price cap July-September 2026.
How to Maximise Your Electricity Savings
- Run appliances 10am–3pm — dishwasher, washing machine, tumble dryer during peak solar. Use delay timers.
- Add a battery — increases self-consumption from 50% to 80%, adding £150–£400/year.
- Use a time-of-use tariff — Octopus Flux/Go adds £100–£300/year through smart import/export.
- Install a solar diverter — routes surplus to hot water (£100–£250/year additional saving).
- Monitor your system — catch faults early. Every month of undetected underperformance costs £40–£70.
- Keep panels clean — 2–5% output recovery = £12–£50/year.
- Choose the best SEG tariff — rates range 4–15p/kWh. Switching from 4p to 12p earns £160/year extra on 2,000 kWh exports.
Frequently Asked Questions
Related guides
Related: Home Heating Systems
Solar panels are most powerful when combined with an efficient heating system. Heat pumps use solar-generated electricity to heat your home at 300-400% efficiency — making them the ideal partner for solar.
Heat pumps use electricity at 300-400% efficiency, making them ideal partners for solar.
From our sister site Home Heat Pump Guide
You might also like
What would this actually cost at your home?
Installed prices vary widely by roof, access and region. Get an installed price for your property from MCS-certified installers.
Get an Installed PriceFree, no obligation. Takes about 2 minutes.